
Figure 4. Charge-neutralizing mutations in the S1–S2 loop.
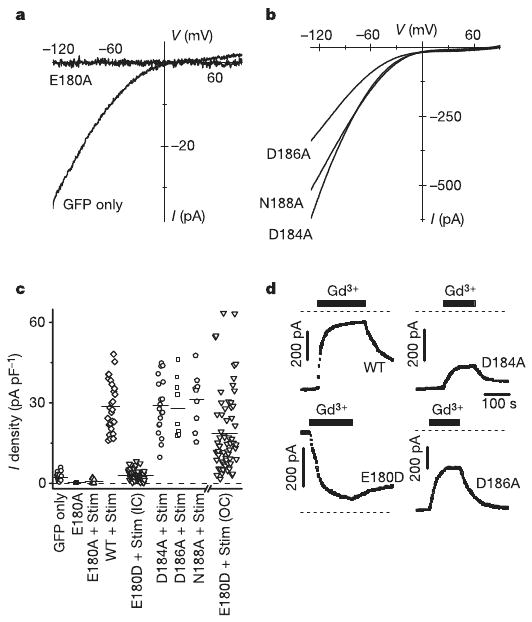
a, I–V curves in a cell expressing the Orai(E180A) mutant (without Stim) compared to control. b, I–V curves for Orai(D184A), Orai(D186A) and Orai(N188A) mutants. c, CRAC current density in transfected S2 cells. Each point represents the maximal CRAC current density (pA pF−1) in a single cell, plotted as absolute values (from left to right): GFP-transfected control; Orai(E180A) (P = 1.7 × 10⁻⁴ relative to control); Orai(E180A) plus Stim (P = 8.2 × 10⁻³); wild-type Orai plus Stim; Orai(E180D) plus Stim, inward current; Orai(D184A) plus Stim; Orai(D186A) plus Stim; Orai(N188A) plus Stim; and Orai(E180D) plus Stim, outward current. d, Suppression of CRAC current by 5 nM Gd3+ in wild-type Orai and the D184A, E180D and D186A Orai mutants. Bars indicate time of Gd3+ application; dashed lines indicate the zero-current level.