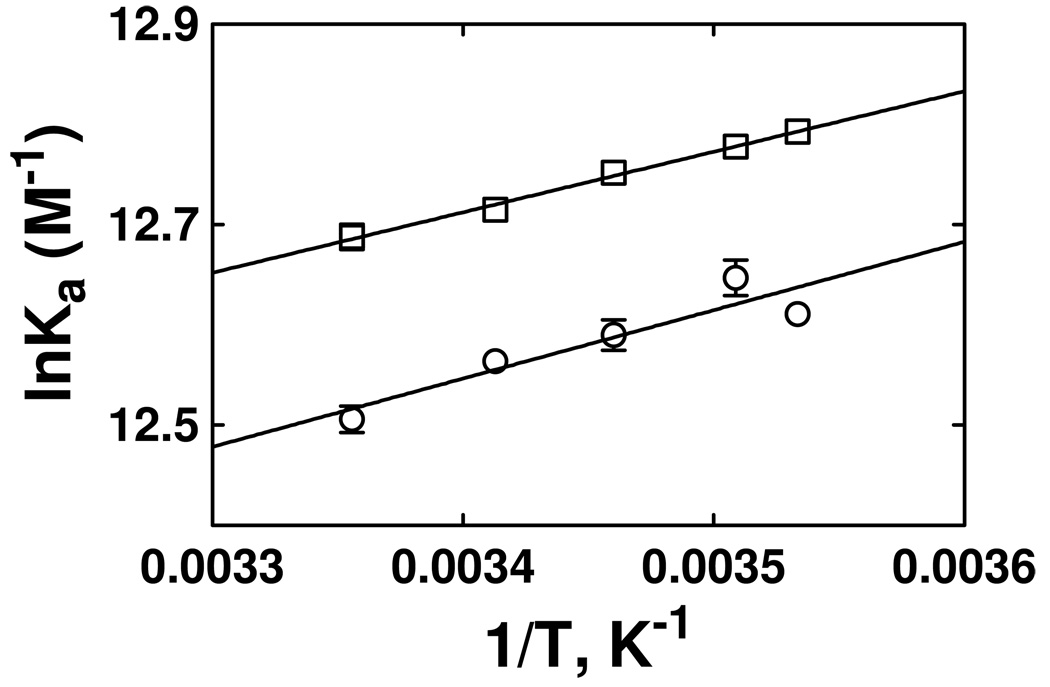
Fig. 5.
Van’t Hoff plots of bupropion determined by elution from the CMAC-Torpedo AChR column at different temperatures (see Fig. 4B). Ammonium acetate buffer (10 mM, pH 7.4) and 15% methanol were used as the mobile phase (0.2 mL/min) to elute bupropion from the CMAC-Torpedo AChR column at different temperatures (10–25°C). The column was pretreated with epibatidine (□) (the AChR is mainly in the desensitized state) or with α-BTx (□) (the AChR is mainly in the resting state), respectively, before bupropion elution. The plots are the results from three experiments (n = 3), where the SD error bars are smaller than the symbol size. The observed r2 values are 0.995 (□) and 0.998 (○), indicating that the plots are perfectly linear. The ΔH° and ΔS° values were determined using the slope (ΔH° = −Slope. R) and y-intercept (ΔS° = y-intercept R) values from the plots, according to eq. 10, where R is the gas constant (8.314 J K−1 mol−1).

