
Figure 1.
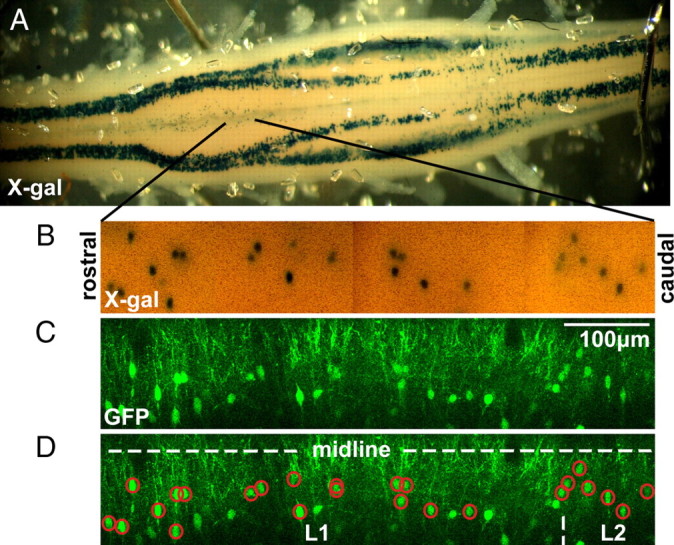
Identification of Hb9 interneurons. A, Spinal cord of an Hb9–GFP/lacZ mouse after an overnight X-gal stain. Hb9-expressing cells, including columns of motoneurons and small clusters of interneurons near the midline from T12–L2, appeared as blue precipitates because they were LacZ+. The T13–L2 ventromedial region had a slight orange tint as a result of the calcium-sensitive fluorescent dyes used for imaging experiments. B, Mosaic of projection images of the ventromedial region of a different spinal cord with X-gal-stained LacZ+ interneurons. Black lines indicate the approximate location in the spinal cord in which these images were taken. C, The corresponding mosaic of projection images of GFP fluorescence taken with a two-photon microscope before X-gal stain. D, By comparing the spatial distribution of the X-gal and GFP fluorescence mosaics over multiple lumbar segments, we can identify post hoc GFP-labeled interneurons that were either Hb9 INs (GFP+/LacZ+, red circles) or ectopically labeled. The locations of the midline and lumbar segments are illustrated by dotted white lines. The width of this image is the width of one lower thoracic or upper lumbar segment (i.e., L1).