Figure 6.
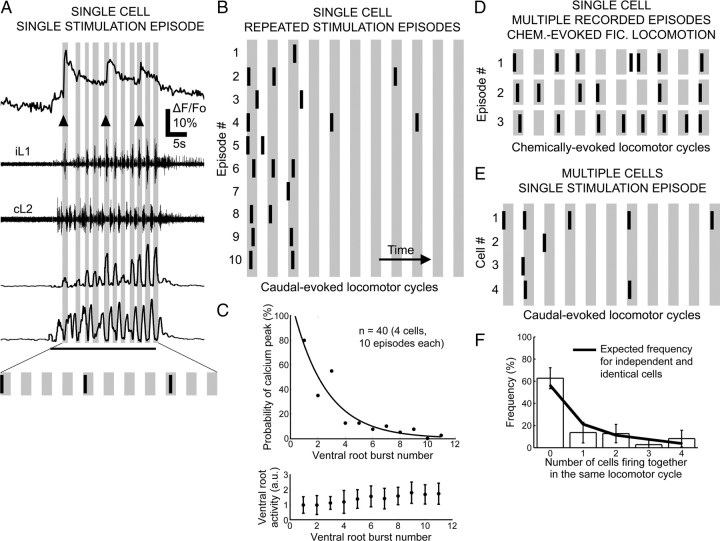
Firing patterns of Hb9 interneurons during a bout of fictive locomotion. A, Representative fluorescence trace of calcium transient from one Hb9 IN (GFP+/LacZ+) during fictive locomotion elicited by electrical stimulation of the caudal spinal cord. Shaded area represents when ipsilateral ventral root is active, and bar represents onset of calcium peak. This is shown schematically at the bottom of the trace. B, Calcium transients of one Hb9 IN during fictive locomotor episodes elicited by electrical stimulations that were repeated 10 times. Patterns of calcium peaks did not repeat and were sparse compared with the number of locomotor cycles. The Hb9 INs tended to show activity at the beginning of a fictive locomotor episode and fall off sharply with repeated bursts during a bout. These data are quantified in C, showing the probability of the neuron delivering a calcium transient for each burst in the bout (data averaged from 40 bouts). By comparison, the integrated areas of ipsilateral and contralateral ventral root activity were relatively stable throughout the bout (bottom graph in C). a.u., Arbitrary units. D, Calcium transients of a single Hb9 IN during fictive locomotion elicited by bath application of 5-HT, NMDA, and DA; the three lines show consecutive records of activity during 30 locomotor cycles. Calcium peaks were observed in most but not all the locomotor cycles. E, During electrically evoked fictive locomotion, four nearby Hb9 INs show uncoordinated calcium transients. F, The frequencies of observing the four cells in E firing together in the same cycle are quantified using 10 bouts. A trend line shows the expected frequencies for four cells if they are independent, identical, and generate calcium peaks with probability as shown in C. Similarity between the trend line and the observed frequency suggest that Hb9 INs were not strongly coupled.

