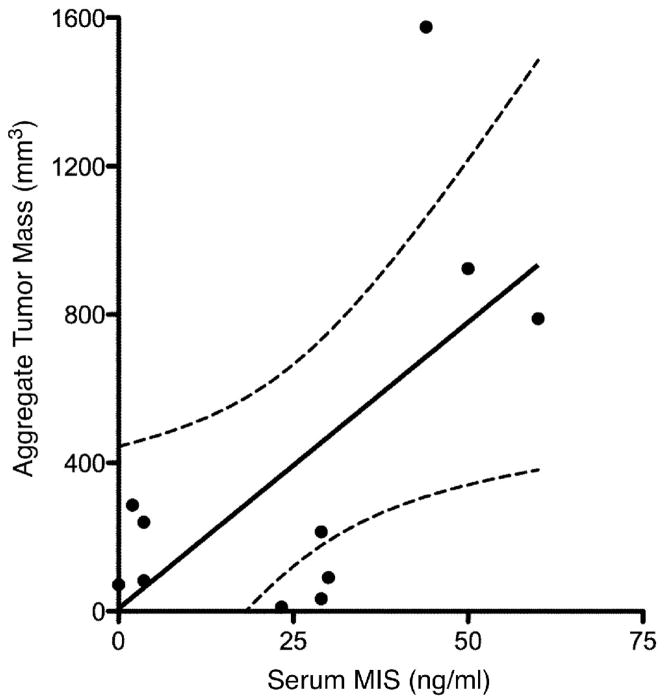
Figure 1. Serum MIS/AMH measurements correlate with gross aggregate tumor mass.
Linear regression analysis shows significant direct correlation between patient serum MIS/AMH levels in ng/ml drawn within 3 days before surgery and gross aggregate tumor mass in mm3 as determined by pathology examination of surgical specimens. Each data point represents a separate patient. The dotted lines indicate 95% confidence bands. (slope=15.4±6.06, r=0.65, p<0.04).

