
Figure 2. Serum MIS/AMH measurements correlates with radiographic aggregate tumor mass.
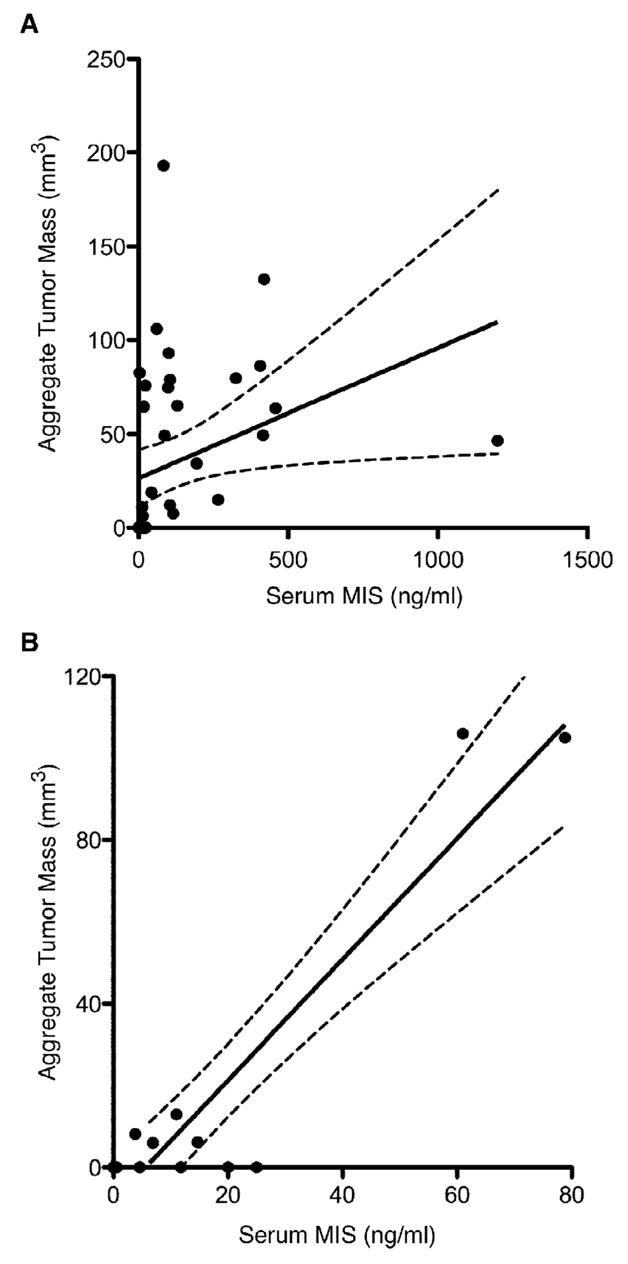
(A) Linear regression analysis shows significant direct correlation between patient serum MIS/AMH levels in ng/ml drawn the day of radiographic study and radiographic aggregate tumor mass. The 43 data points includes measurements from 13 patients during the course of follow-up. The dotted lines indicates 95% confidence bands. (slope=0.07±0.03, r=0.33, p<0.04). (B) To reduce selection bias, the single smallest tumor size estimation by radiology for each patient was correlated with serum MIS/AMH levels drawn the same day. Linear regression analysis of this subset also shows significant correlation. Each data point represents a separate patient. The dotted lines indicate 95% confidence bands. (slope=1.45±0.17, r=0.93, p<0.01).