
Figure 3. Serum MIS/AMH measurements correlates with radiographically detectable GCT mass.
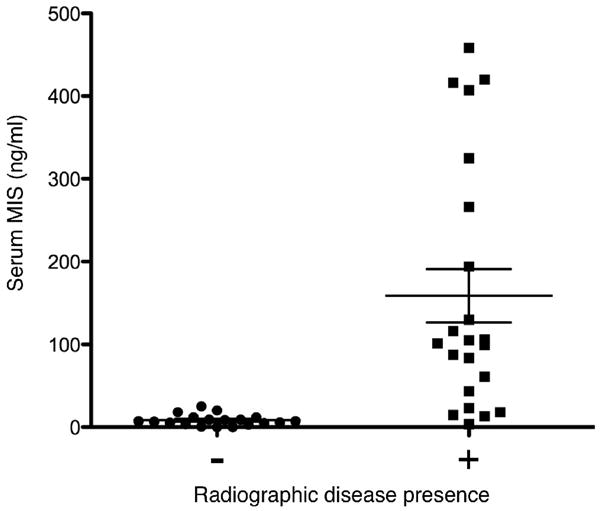
A comparison of serum MIS/AMH levels in ng/ml drawn the day of radiology studies that reported no detectable masses (n=19) to levels drawn the day of radiology studies that reported a detectable mass (n=22) in follow-up GCT patients showed that levels were significantly lower at times when a mass was detected by either abdominal CT or MRI (8.16±1.54 vs. 158.7±32.2 ng/ml, p<0.0001). Error bars represent standard error of the mean.