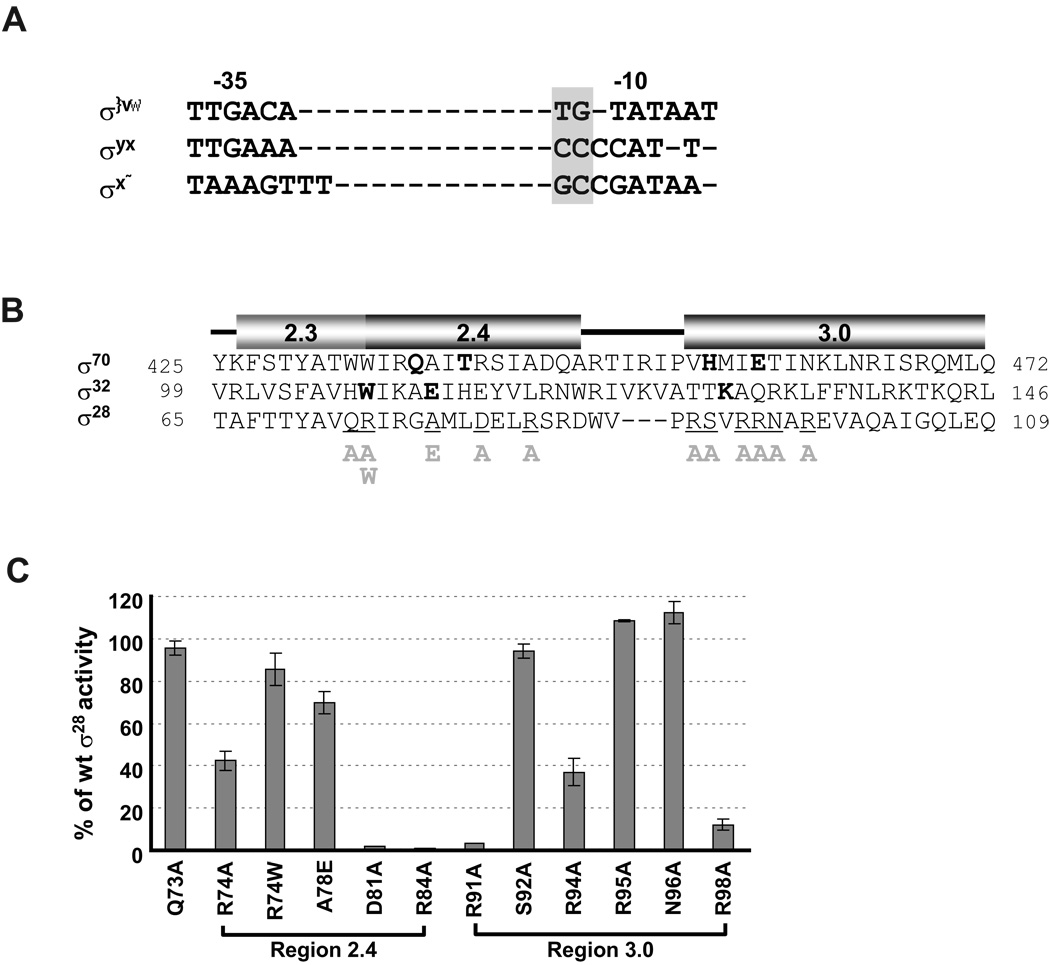
Figure 3. Effects of single amino acid substitutions in Region 2.4 and 3.0 of σ28 on activity of the wt tar promoter.
A. Alignment of consensus core −10 and −35 sequences of E. coli σ70, σ32 and σ28 promoters. The extended −10 motifs of each promoter are denoted by grey shading.
B. Alignment of amino acid sequence of Regions 2.3, 2.4 and 3.0 of σ70, σ32 and σ28. Numbers at each end of sequence indicate amino acid position. Amino acid residues of σ70 and σ32 involved in base specific recognition are shown in bold (Koo et al., 2009, Kourennaia et al., 2005, Sanderson et al., 2003, Siegele et al., 1989). Positions of single amino acid substitutions of σ28 used in this study are underlined and the substitutions are shown below the main sequence. The predicted helices at each region was derived from structural data of Thermus aquaticus σA and Aquifex aeolicus σ28 (Campbell et al., 2002, Sorenson et al., 2004) and are shown above the sequences.
C. β-galactosidase activity driven by each σ28 variant on the wt tar promoters are shown as a percentage of measured β-galactosidase activity driven by wt σ28. Assay strains are as described in Fig 1B.The different σ28 amino acid substitutions and their locations are shown on the x-axis. All values are averages of three independent experiments; error bars indicate 1 standard deviation.

