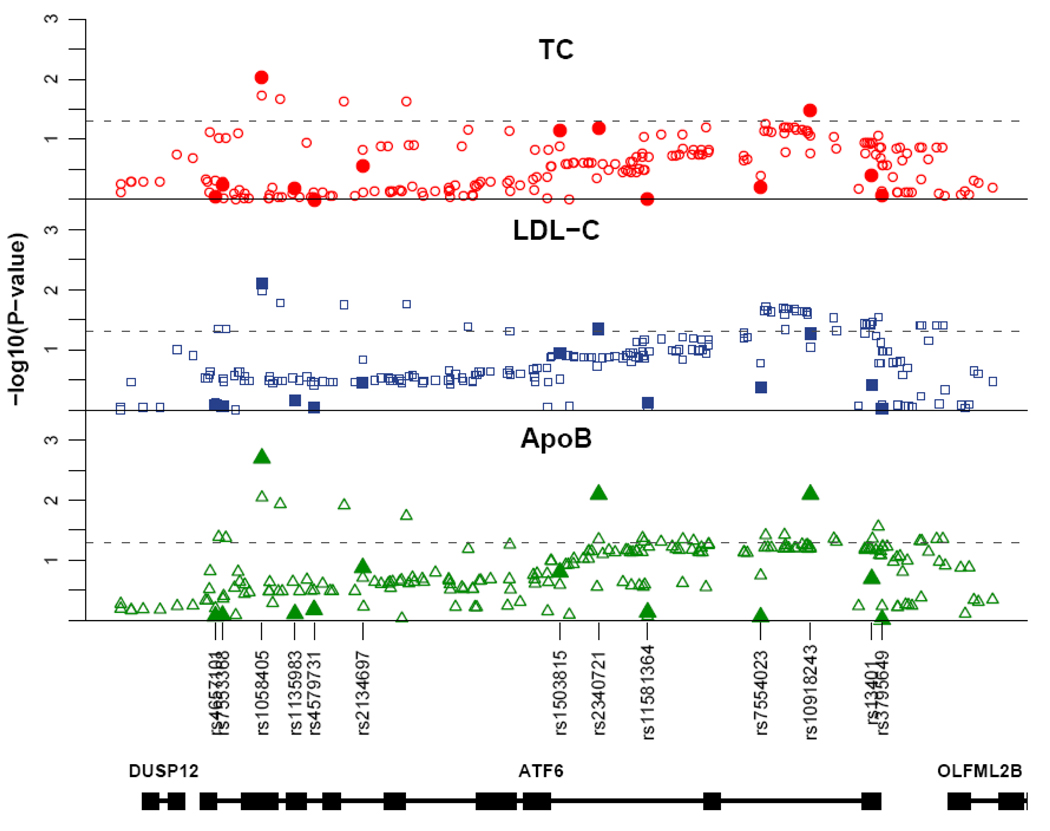
Figure 1.
Association results of stage 1. Filled symbols represent the –log10 of the P-values obtained from linear regression test for the genotypic model. The open symbols represent the –log10 of the P-values obtained from Bayesian regression test with SNP imputation. The dashed lines indicates P=0.05. The location of the SNPs is shown in relation to the gene structure of ATF6 and its adjacent genes.

