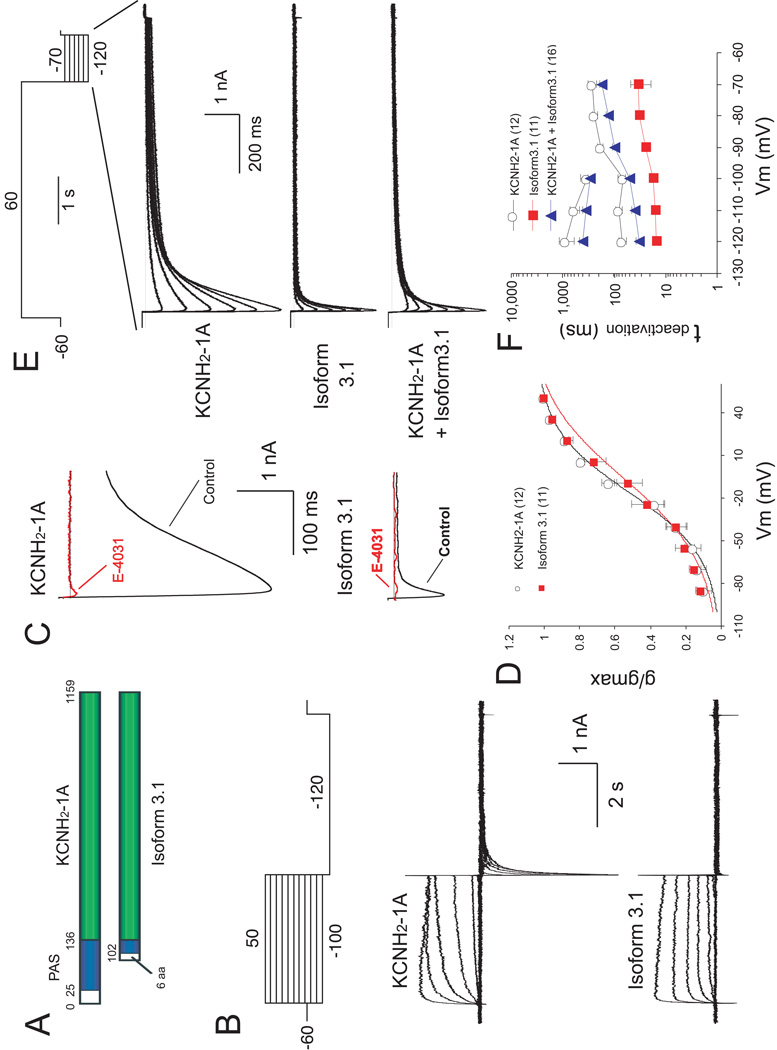
Figure 5. Characterization of KCNH2 currents in HEK293T cells expressing KCNH2-1A and Isoform 3.1.
(A) Schematic diagram of KCNH2-1A and Isoform 3.1 domain structures. Blue box: PAS domain. Green box: conserved amino acid sequences l between isoforms. Numbers correspond to amino acid positions. (B) Currents evoked by voltage steps (4 sec) from VH of −60 mV to potentials from −100 to +50 mV in 10-mV increments, followed by a voltage pulse to −120 mV (5 sec). Upper panel: voltage protocol. Middle and lower panels: traces (corrected for leak currents) recorded from cells transfected with KCNH2-1A and Isoform 3.1 cDNAs, respectively. (C) Effects of E-4031on tail currents evoked by a test pulse to −120 mV from holding potential of +50 mV, using the same protocol as in B. Traces recorded from the same cells before (black) and after (red) treatment with 10 µM E-4031 are superimposed. Upper and lower panels show KCNH2 currents recorded from cells transfected with KCNH2-1A and Isoform 3.1 cDNAs, respectively. (D) Steady-state activation curves of KCNH2-1A and Isoform 3.1 tail currents, which were induced by the protocol shown in B. The reversal membrane potential (Vrev) under the recording conditions was −96 mV. The V1/2 for KCNH2-1A and Isoform 3.1 are −16.37 ± 2.55 mV and −6.54 ± 4.04 mV, respectively (p<0.05). In this and subsequent figures, the data are presented as mean ±1 SEM. Numbers in parentheses indicate the number of cells recorded. (E) Tail currents evoked by voltage steps from +60 mV to potentials between −120 mV and −70 mV in 10 mV increments. Traces in upper, middle and lower panels represent tail currents of KCNH2-1A, Isoform 3.1 and co-transfection KCNH2-1A with Isoform3.1, respectively. (F) Semilogarithmic plot of deactivation time constants of KCNH2-1A and Isoform3.1 currents at different repolarizing voltages. Upper plot (between −210 and −100 mV) corresponds to τ2 for HEK cells transfected with KCNH2-1A alone or cotransfected KCNH2-1A and Isoform 3.1, whereas the lower plots correspond to τ1 for all transfection combinations.

