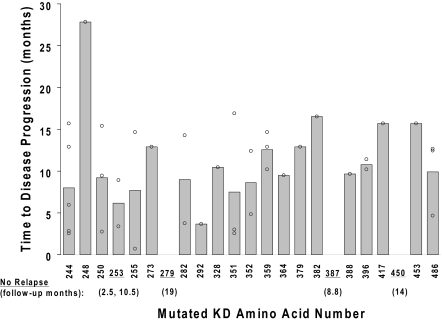
Figure 4.
Time to disease progression after mutation discovery. The time from the initial discovery of a KD mutation to subsequent disease progression (y-axis) is plotted against the location of the mutation (kinase domain amino acid number; x-axis). The 37 data points reflect the presence of multiple mutations in some of the 29 patients with disease progression after a mutation was discovered. Shaded bars depict average values for each mutation location. Underlined codons represent the mutation location of 5 patients with no subsequent disease progression during follow-up. For these 5 patients, the follow-up time from mutation discovery to the last monitoring visit is indicated in parentheses.

