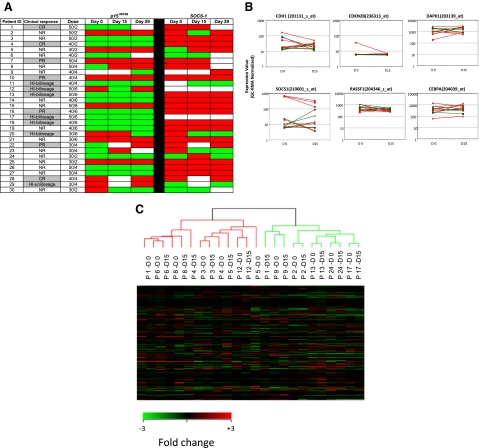
Figure 4.
Methylation status and gene expression of candidate TSGs in purified CD34+ hematopoietic progenitors. (A) Promoter methylation of p15INK4B and SOCS-1 was monitored by MSP in CD34+ cells from 30 patients before treatment (day 0) and on days 15 and 29 of the first cycle of therapy. There is no association of reversal of candidate TSG methylation status with clinical response to combination therapy with 5AC and entinostat. Red color indicates methylated status, green color indicates unmethylated status, and white color indicates sample was unavailable. Notations as per Figure 1. (B) Plots (log scale) of normalized gene expression in evaluable patients before and after 1 cycle of 5AC/entinostat therapy in TSG genes tested for methylation status as well as 2 other genes (RASSF1 and CEBPA) frequently hypermethylated in MDS. Green indicates clinical responder; and red, clinical nonresponder. (C) Hierarchical clustering of individual patients (n = 12) at day 0 and day 15.

