
Figure 3.
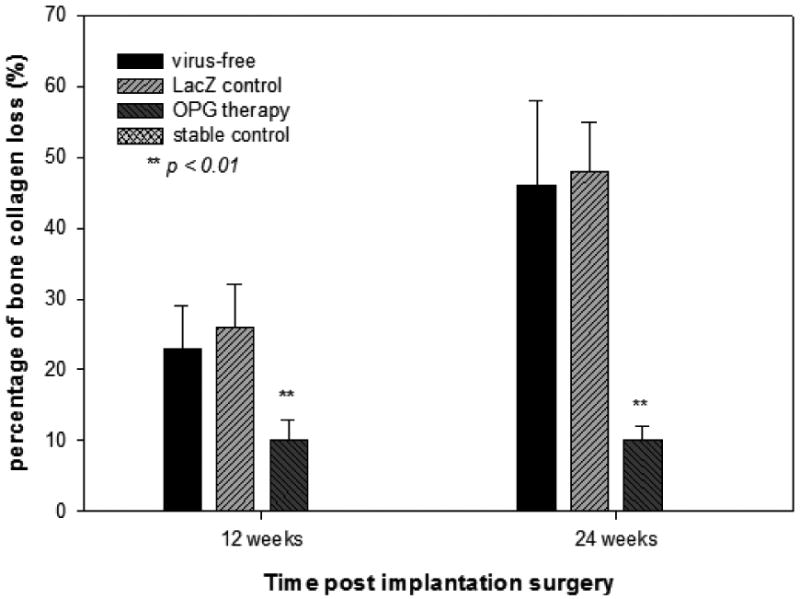
Summary of the bone collagen degradation quantified by a computerized image analysis system using image-Pro® on the modified Trichrome staining sections. The integrated optical density readings from 4 areas per tissue sections and at least 3 or 4 animals per time point per group were averaged and compared. The data is expressed as the percentage of bone collagen loss against the readings from the stable control group (**p< 0.01).