
Figure 6.
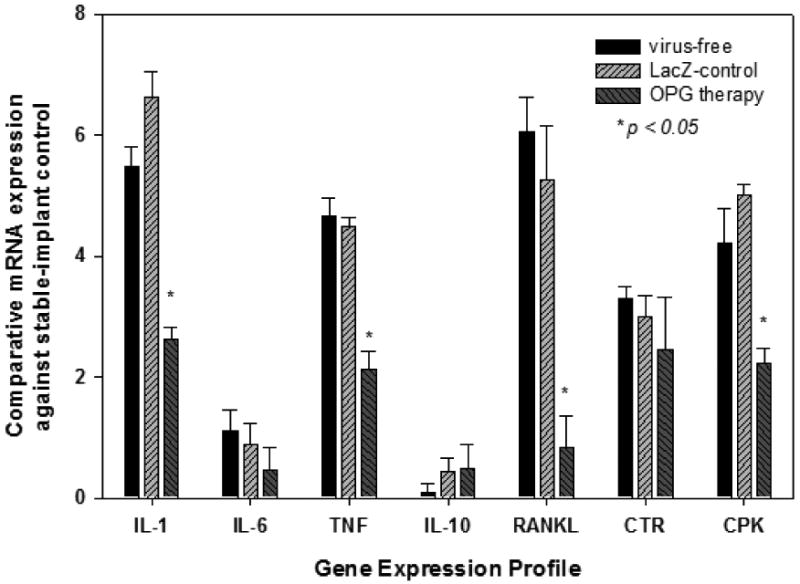
Gene Expression Profiles responding to the in vivo gene modifications during the course of the experimentation. The data are expressed as comparative gene copies against readings from the stable-implant control (see Materials & Methods, *p<0.05).