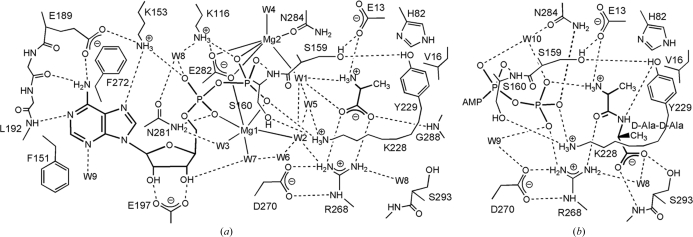
Figure 5.
Schematic diagram showing hydrogen bonds and coordinate interactions. Putative hydrogen-bond interactions are shown by dotted lines if the acceptor and donor are less than 3.5 Å apart. (a) TtDdl–ADP–d-Ala complex. Coordinate bonds between Mg ions and the ligands are less than 2.6 Å apart. (b) TtDdl–ATP–d-Ala-d-Ala. The AMP moiety of ATP and the residues interacting with it are omitted because the interactions are essentially the same for TtDdl–ADP–d-Ala and TtDdl–ATP–d-Ala-d-Ala.

