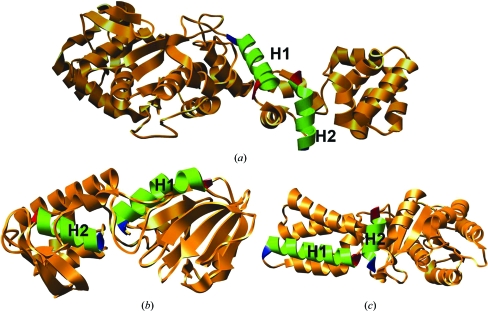
Figure 1.
Representative examples for each class of EE helix pairs. (a) C–C helix pair in the structure of a glutamyl tRNA synthetase (PDB code 1g59; 2.4 Å resolution). The C-terminal region of helix H1 (residues 306–321 of chain A) interacts with the C-terminal region of helix H2 (residues 344–356 of chain A). (b) N–N helix pair in the structure of a bacterial DNA glycosylase enzyme (PDB code 1r2y; 2.34 Å resolution). The N-terminal regions of helix H1 (residues 3–19 of chain A) and helix H2 (residues 173–184 of chain A) interact with each other. (c) N–C helix pair observed in the crystal structure of a conserved GTPase (PDB code 1j8m; 2.0 Å resolution). The N-terminal region of helix H1 (residues 20–39 in chain F) and the C-terminal region of helix H2 (residues 254–264 in chain F) make interhelical contacts. In this figure and in the subsequent figures the first and the last residues of a helix are displayed in blue and red, respectively, to indicate the N- and C-terminal regions and some helices are omitted for clarity. All molecular images were created using the UCSF Chimera package from the Resource for Biocomputing, Visualization and Informatics at the University of California, San Francisco (Pettersen et al., 2004 ▶).

