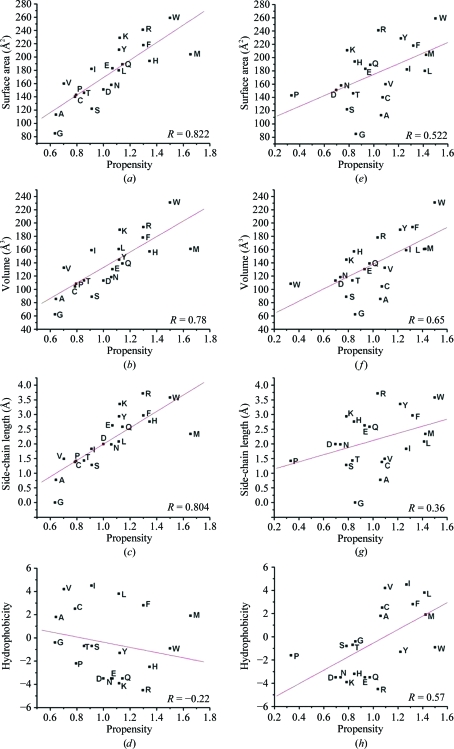
Figure 3.
Plots showing the relationships between various properties of residues and their propensities to occur in the interface of EE and EM helix pairs (a–d) and interacting non-EE/EM helix pairs (e–h) of soluble proteins. Residue propensities are plotted against surface area (a, e), residue volume (b, f), length of the side chain (c, g) and hydrophobicity (d, h). The correlation coefficient between the residue propensity and the property under consideration is displayed in each graph. The function ‘linear fit’ available in Origin v.6.1 Pro (http://www.originlab.com) was used to fit the data and calculate the correlation coefficients.

