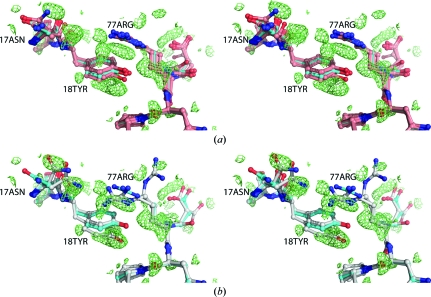
Figure 3.
Stereo representation of a heterogeneous area around residues Tyr18 and Arg77 in 2nlv. (a) The single-conformer reference model is shown in cyan. Positive density of the mF o − DF c difference map corresponding to the single model, shown in lime, is contoured at 1.75σ. (b) Our multi-conformer model, shown in grey, neatly models alternate conformers of Asn17, Tyr18 and Arg77 in the positive density, albeit at the cost of a small misfit in the B conformer of Arg77. The algorithm did not find sufficient evidence for the Asn17 side-chain conformation of the reference model. Examination of the difference map reveals a substantial negative peak in this area (not shown).

