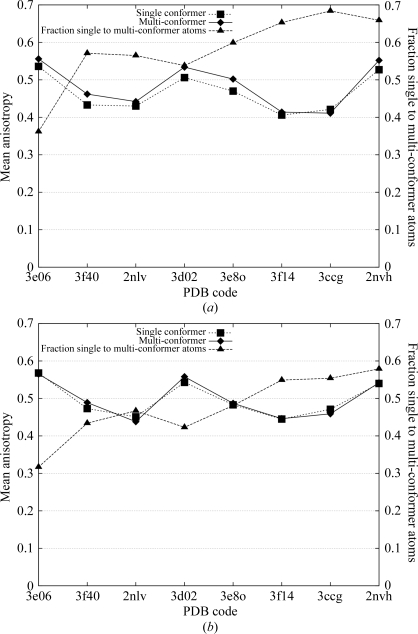
Figure 5.
Mean main-chain (a) and side-chain (b) anisotropy for eight selected high-resolution structural models. Listed along the horizontal axis are the PDB codes of the eight test structures in order of decreasing resolution. The single-conformer reference models are represented by squares and our multi-conformer models by diamonds. Triangles depict the ratio of the number of single-conformer atoms to the number of multi-conformer atoms.

