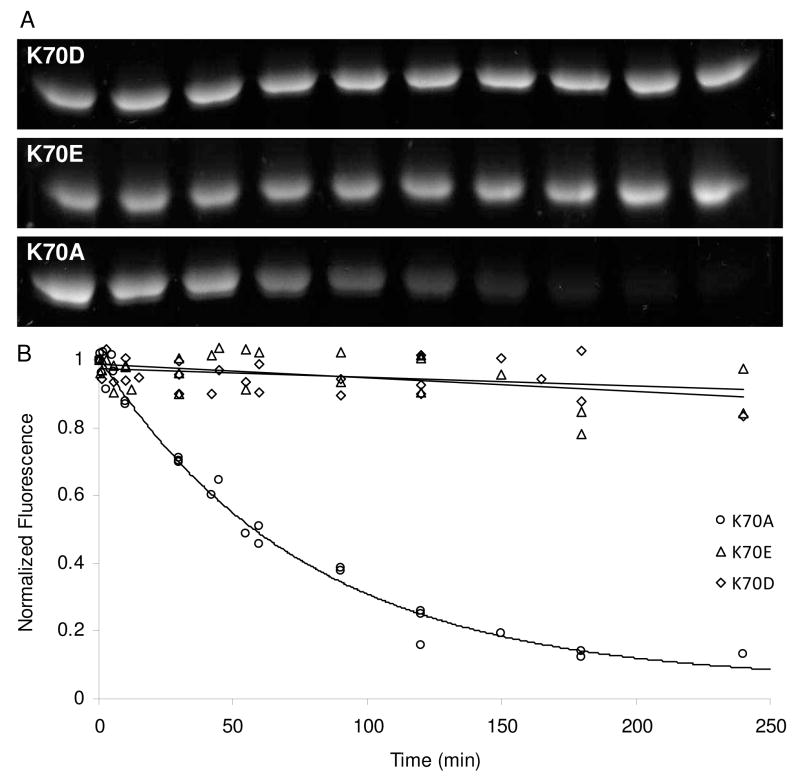
Figure 6.
BOCILLIN FL™ deacylation rates of three different K70 mutants assessed by SDS-PAGE. (A) BOCILLIN FL™ complexes with K70 mutants were separated by SDS-PAGE and the fluorescence was visualized with ultraviolet light (365 nm). (B) Fluorescence intensity was quantitated and plotted as a function of time (three separate trials combined). K70D and K70E were fit by linear regression and K70A was fit to a single exponential decay.

