Fig. 1.

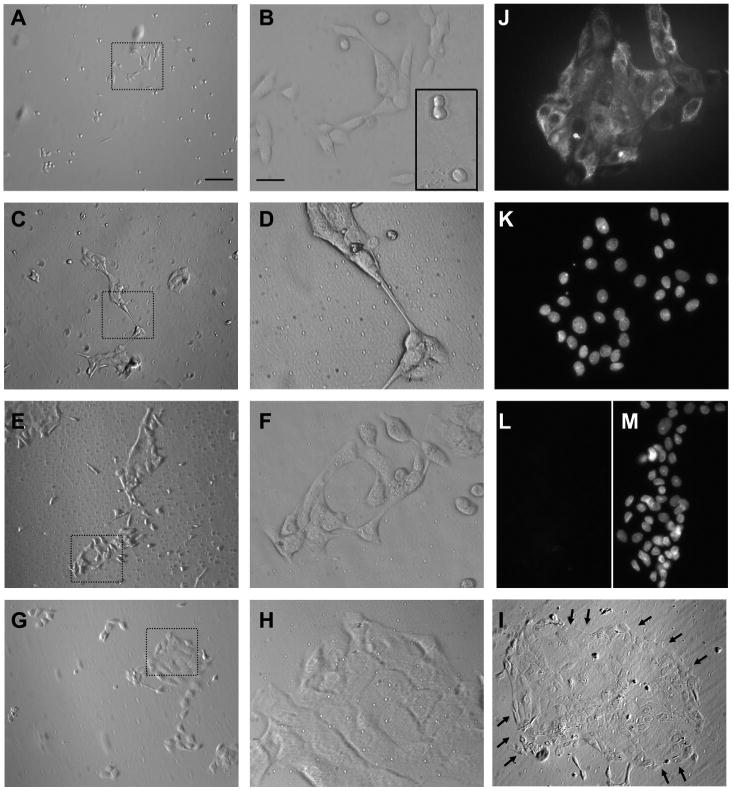
Micrographs of urothelial cells cultured for different periods of time (2–6 days). A–I: pictures of live urothelial cells that have been in culture for 2 (A, B), 3 (C, D), 4 (E, F), 5 (G, H), and 6 (I) days. A, C, E, G, and I are at ×10 magnification. Dotted areas in A, C, E, and G are shown in higher magnification (×40) in B, D, F, and H. I: arrows outline a large island of cells. J, K: pictures of the same field of cells stained with cytokeratin 17 (CK 17) antibodies (J) and with DAPI for nuclear staining (K), from a 2-day-old culture, indicating that the majority of cells were positive for CK 17. L, M: pictures of the same field of cells stained with cytokeratin 20 (CK 20) antibodies (L) and with DAPI for nuclear staining (M), from a 2-day-old culture, illustrating the absence of CK 20 in these cells. Cell density for culture shown in A–I was 60 × 104 cells/ml and for culture shown in K–M was 80 × 104 cells/ml. Scale bar for A, C, E, G, and I is 100 μm and is shown in A. Scale bar for B, D, F, H, and J–M is 25 μm and is shown in B.
