Fig. 4.

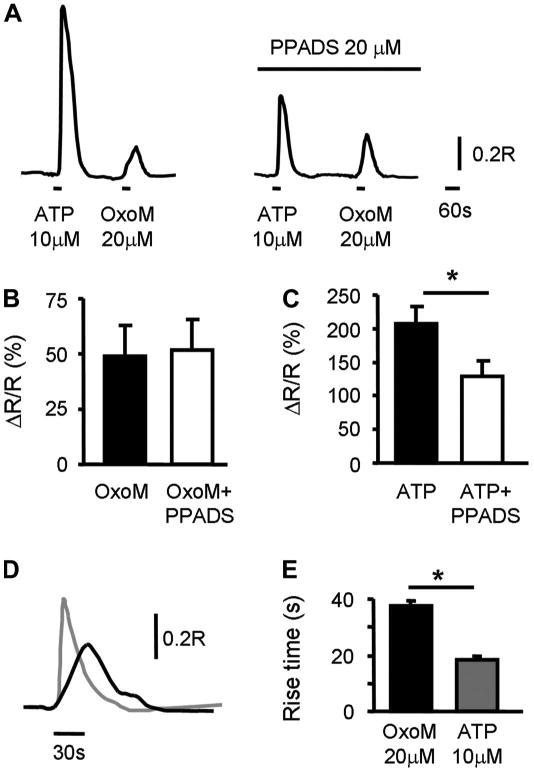
Role of purinergic receptors in OxoM-evoked Ca2+ responses. A: example of ATP (10 μM, 30-s application)- and OxoM (20 μM, 30-s application)-evoked Ca2+ responses in the absence and in the presence of PPADS (20 μM). Cells were preincubated with PPADS for 10–15 min. B, C: summary of OxoM-evoked Ca2+ responses (B) and ATP-evoked Ca2+ responses (C) from n = 14 cells. *Significant changes (P < 0.05) from control tested with paired t-test. D: rise times of OxoM- and ATP-evoked Ca2+ responses are different. Example of OxoM (20 μM, 30-s application; black trace) and ATP (10 μM, 30-s application; gray trace) responses from the same cell. Traces are superimposed and aligned with respect to the starting point of the Ca2+ response. E: summary of rise times. Data are from n = 128 cells for OxoM and n = 65 cells for ATP response. *Significant differences (P < 0.05) tested with unpaired t-test.
