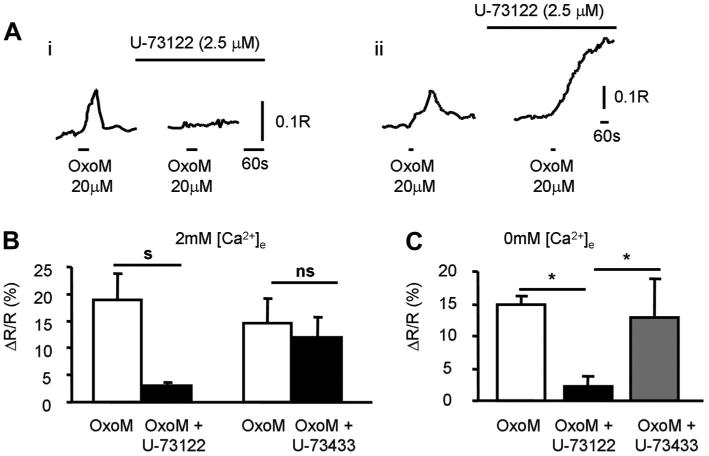
Fig. 7.

Intracellular pathways activated by mAChRs. Ai: example from a single urothelial cell of an OxoM (20 μM, 30-s application)-elicited response which was abolished in the presence of the PLC inhibitor U-73122 (2.5 μM). Aii: example from a single urothelial cell of an OxoM (20 μM, 30-s application)-elicited response which was not abolished in the presence of the PLC inhibitor U-73122 (2.5 μM) but it did not return to baseline. External [Ca2+] was 2 mM in both examples. B: summary of the effects of PLC inhibitor U-73122 (n = 30 cells; 10 coverslips from 6 cultures) and the inactive analog U-73433 (n = 24 cells; 6 coverslips from 3 cultures) on OxoM-elicited responses in 2 mM external [Ca2+]. s, ns indicate significant changes (s; P < 0.05) or not significant changes (ns; P > 0.05) tested with paired t-test. C: summary of OxoM-elicited responses from coverslips that were incubated in 0 mM external [Ca2+] alone (white bar; n = 28 cells; 3 coverslips from 3 cultures), with the PLC inhibitor U-73122 (2.5 μM; black bar; n = 26 cells; 3 coverslips from 3 cultures), or with the inactive analog U-73433 (2.5 μM; gray bar; n = 23 cells; 3 coverslips from 3 cultures). *Significant changes (P < 0.05) tested with ANOVA followed by Bonferroni post hoc test.
