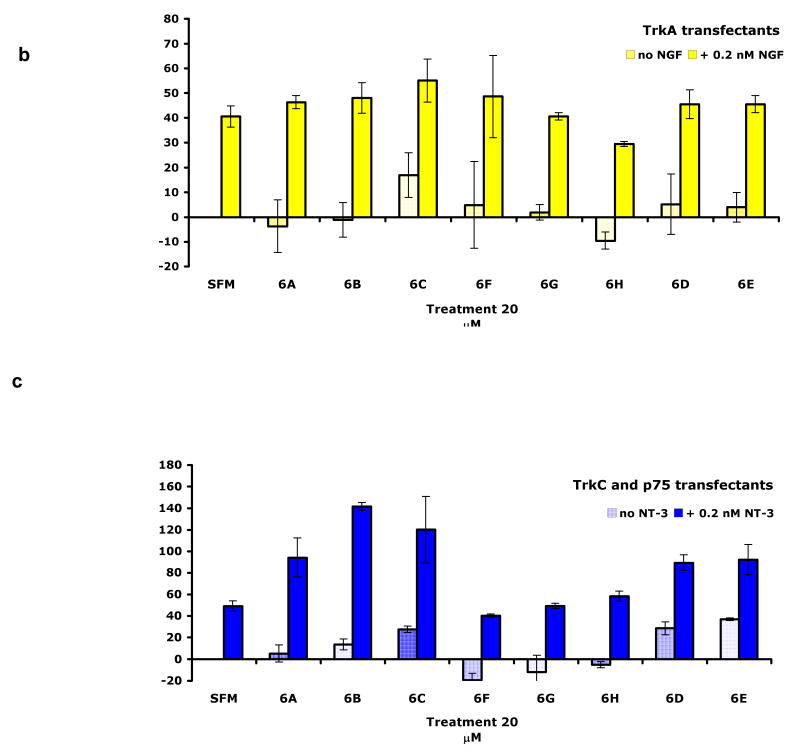
Figure 3.
Cell survival assays. NIH-3T3 cells expressing either a TrkC (NIH-TrkC), b TrkA (NIH-TrkA), or c TrkC and p75 (nnr5-TrkC cells) were cultured in SFM supplemented with the indicated peptidomimetics (20 μM) with or without the appropriate growth factor (NGF for TrkA, NT-3 for TrkC) at optimal or suboptimal concentrations as indicated. Survival was measured in MTT assays, and was calculated relative to optimal neurotrophin (2 nM; 100% survival; 0.2 nM is therefore a suboptimal dose). Results shown are average ± SEM, from at least three independent assays, with each assay n = 4-6.


