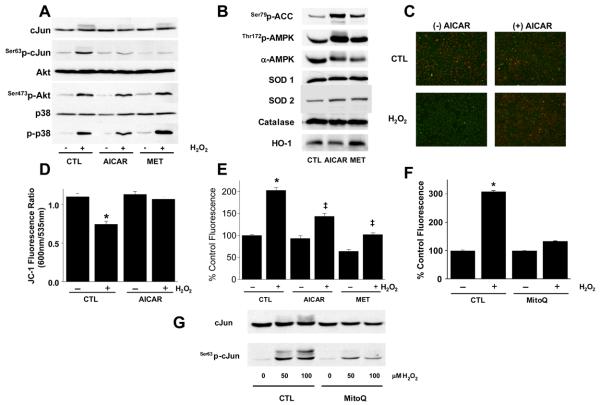
Figure 3. AMPK-mediated adaptation involves the mitochondrion.
(A) PAECs in 6-well plates were exposed to AICAR, metformin (MET), or buffer alone (CTL) as in Fig. 2 followed by assessment of JNK, Akt, and p38 MAP kinase activation as described.50 (B) PAECs treated as in (A) were lysed and the content of the indicated proteins determined by immunoblotting. (C) PAECs treated with AICAR as in (A) were washed and exposed to 100 μM H2O2 (60 min) before loading with 2.5 μg/ml JC-1 (final conc.) and then examined either qualitatively by microscopy (C) or quantitatively (D) in a plate reader for red (ex 550nm; em 600nm) and green (ex 485nm; em 535nm) fluorescence. Images are representative of 3 independent experiments and quantitative analysis represents mean ± S.E.M of 3 independent experiments; *p<0.05 vs. without H2O2 by two-way ANOVA and a Tukey's post hoc test. (E) PAEC were treated as in (A) and loaded with 10μM dihydrorhodamine before H2O2 treatment and fluorescence (ex 480nm, em 535nm) detection; n=5, , ‡ p<0.05 vs. control H2O2 treated by two-way ANOVA and a Tukey test. PAEC were incubated with 1μM MitoQ as described14 before assessment of H2O2-induced mitochondrial ROS (F) or H2O2-induced JNK activation (G); images are representative of n=4, *p<0.05 vs. no H2O2.

