FIGURE 3.
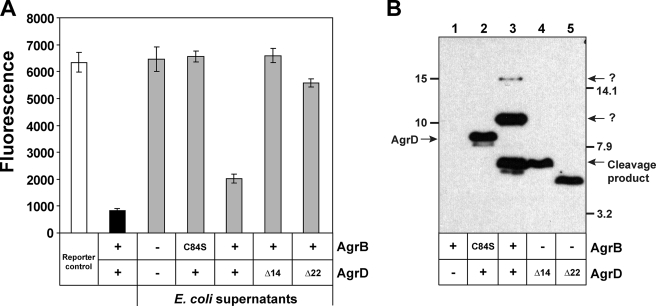
Development of an AgrB cleavage assay. A, agr inhibition bioassay. White bar indicates reporter strain grown with supplements. Black bar is SH1001 with plasmid pAgrD1 as a positive control. All gray-shaded bars are E. coli cell-free supernatants with empty vector or different agrB and agrD constructs as indicated. Constructs Δ14 and Δ22 are AgrD truncations from the C terminus. B, immunoblot of E. coli cell lysates with the same agrB and agrD constructs. Blots were probed with antibody for the AgrD N-terminal His6 tag. Bands corresponding to full-length AgrD and cleavage product are shown, and the AgrD Δ14 truncation serves as a size standard for the cleavage product. The bands present at 10 and 15 kDa are unknown and labeled with question marks.

