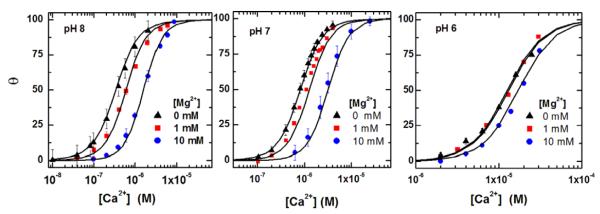
Fig. 2.
Dependence of calcium binding isotherms on pH and free magnesium ion concentration in the solution; each isotherm curve is normalized by the maximal bound Ca2+ concentration at saturating values of free Ca2+ concentration in the solution. θ denotes normalized bound calcium concentration and [Ca2+] denotes the free calcium ion concentration in the solution. Symbols are measurements made at thermal equilibrium conditions in the absence of ATP and at room temperature. Each measured isotherm curve is also fitted to the Hill equation and corresponding fitting parameters EC50 and Hill slope are listed in Table 1. Solid lines are model fits using Eq. (12) with fitting parameters listed in Table 2.

