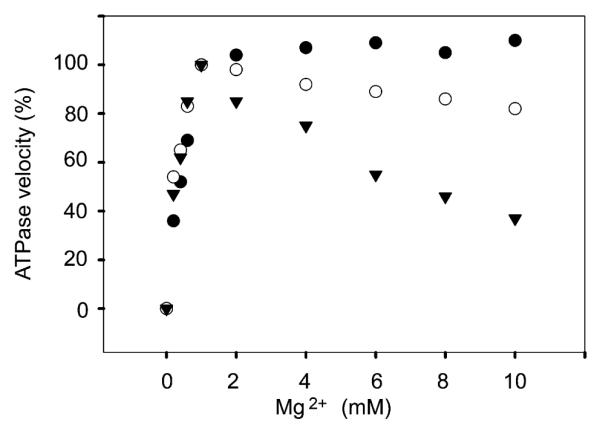
Fig. 3.

Steady state ATPase activity at various pH and Mg2+ concentrations. ATPase activity was followed by colorimetric measurement of Pi, in the presence of 5 μM Ca2+, 20 mM MES pH 6 (●), or MOPS, pH 7 (○), or Hepes pH 8 (▼), as described in Methods. The Mg2+ concentration was varied as indicated in the figure.
