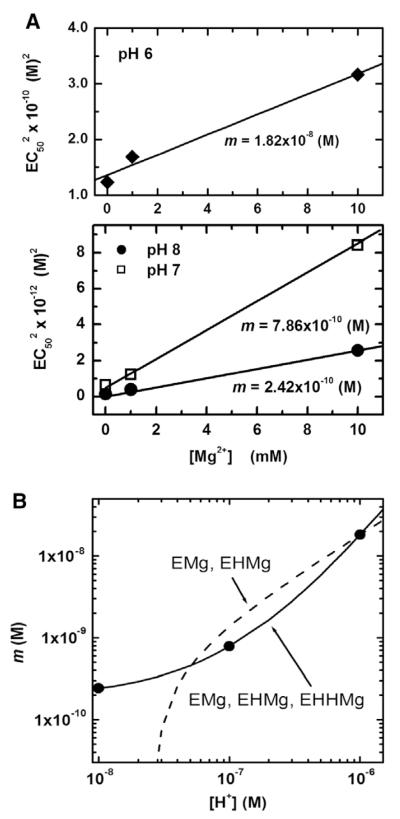
Fig. 4.
(A) Dependence of on the free [Mg2+] in the solution at fixed pH values of 6, 7 and 8. Symbols are measured EC50 values as listed in Table 1. Solid lines are linear fits with m and A as fitting parameters, consistent with the model Eq. (14). (B) Dependence of m on the free H+ concentration in the solution. Symbols are m values obtained from Fig. 4(A). Solid line is the proposed model fit (Eq. (13B)) that assumes EMg2+, EH+Mg2+ and E2H+Mg2+ as the three magnesium related SERCA species; dashed line is an alternate model fit that is identical to the proposed model except EMg2+ and EH+Mg2+ are assumed as the two magnesium related species.

