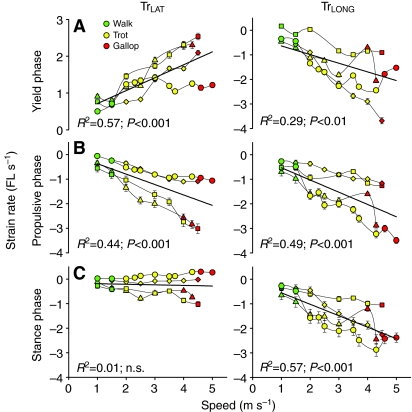
Fig. 6.
Effect of speed (m s–1) on fascicle strain rate (fascicle lengths s–1) of the TrLAT (left) and TrLONG (right) in (A) yield phase, (B) propulsive phase and (C) over stance phase. Walks are in green, trots in yellow and gallops in red. Each individual is denoted by a different symbol; values are means and s.e.m. Regression lines, r2 values, and P values are fitted to the entire data set, and P-values for speed as a covariate for all gaits are given in Table 2. Rate of stretch increased in the TrLAT for yield phase as did shortening for stance phase, but no increases in rate were detected over net stance. Strain rate increased in all phases of stance for the TrLONG.

