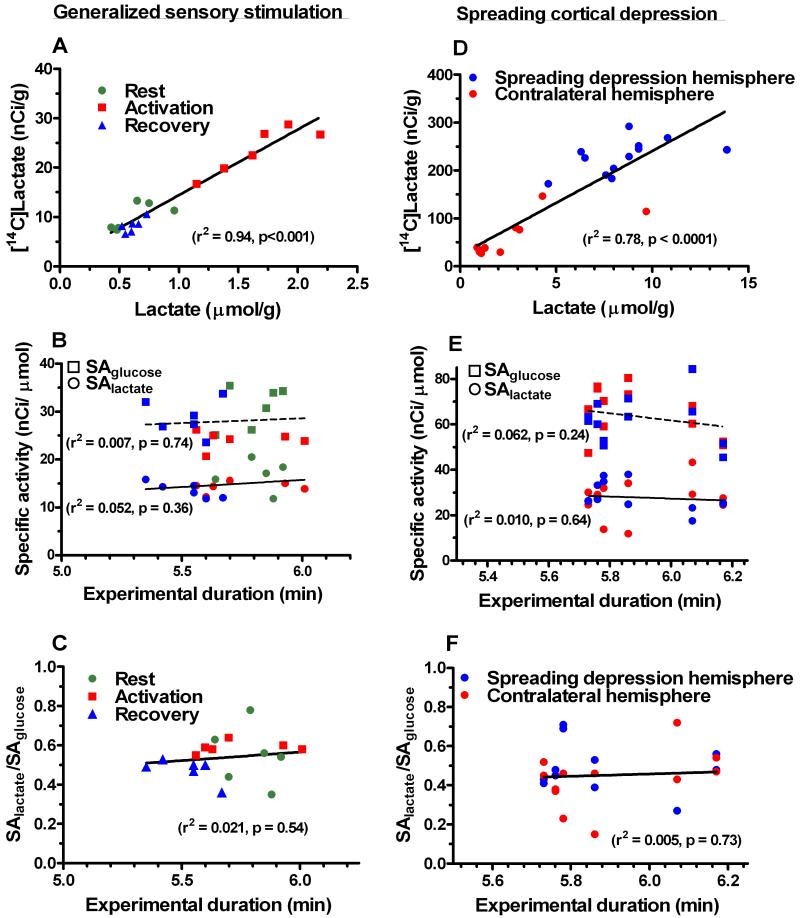
Fig. 2. Levels of 14C-labeled and unlabeled lactate in brain and lactate relative specific activities.
Values are from individual rats sampled during rest, sensory stimulation, or recovery from generalized sensory stimulation (A, B, C; Dienel et al., 2002), or during unilateral K+-induced spreading cortical depression or in the contralateral cerebral cortex (D, E, F; Adachi et al., 1999). Labeled and unlabeled lactate levels (A, D), specific activities (SA) of brain glucose (squares) and lactate (circles) (B, E), and ratios of specific activities of lactate to those for glucose (C, F) were determined in each animal. Color codes in B are the same as in A and C, and those in E correspond to D and F. Linear regression lines were calculated for each data set.

