
Figure 2.
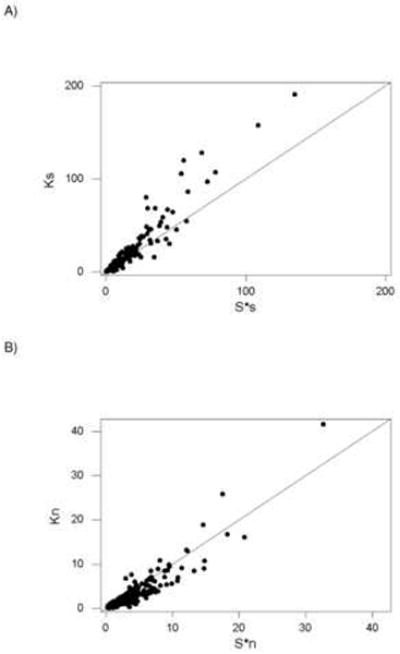
Plots of (A) mean number of synonymous differences (Ks) vs. the adjusted number of synonymous segregating sites (S*s); and (B) mean number of nonsynonymous differences (Kn) vs. the adjusted number of nonsynonymous segregating sites (S*n) based on 1-substitution codons in 222 virus sequence datasets. In each case, the line is a 45° line. Sign test of the equality of paired Ks and S*n: N.S. Sign test of the equality of paired Kn and S*n: P < 0.001.