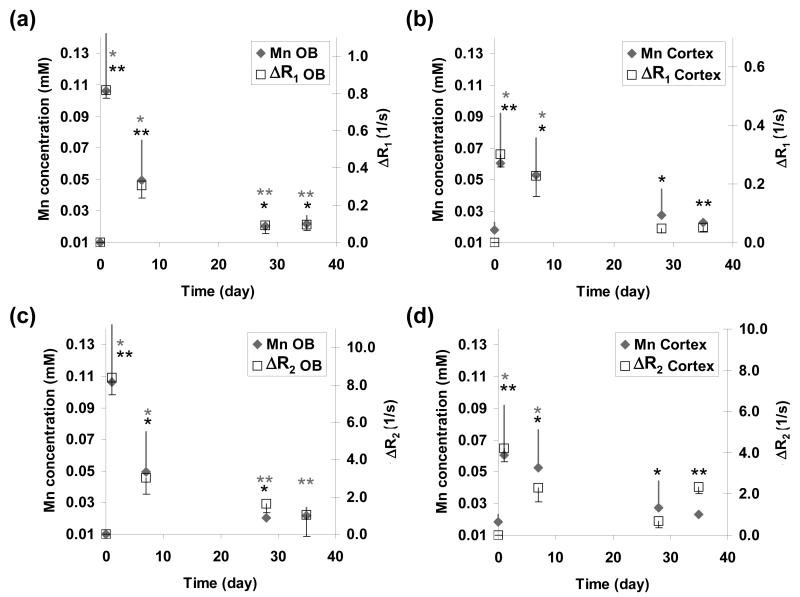
Fig. 2.
Temporal changes in (a, b) ΔR1 (open square), (c, d) ΔR2 as a function of Mn concentration (gray diamond) in the OB and cortex. The star symbols (gray for Mn concentration; black for ΔR1 or ΔR2) represent statistical significance compared to day 0: * p < 0.05; ** p < 0.01; error bar = 1 standard deviation.

