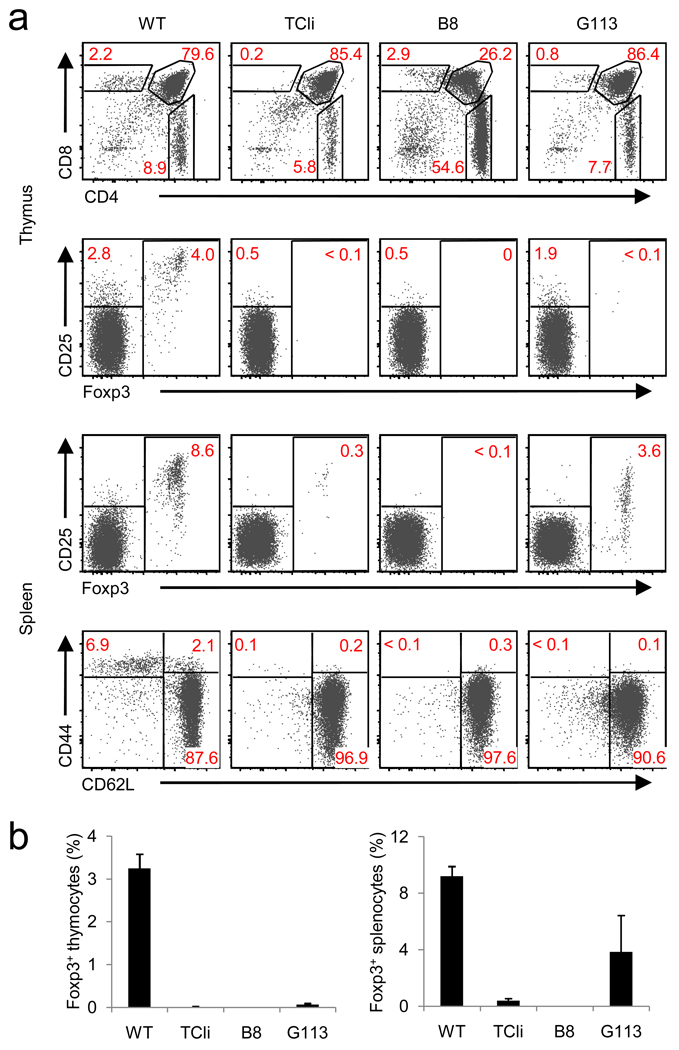
Figure 1.
Flow cytometric characterization of TCR transgenic lines. (a) FACS plots of thymic and splenic T cells from 6-week old TCR transgenic Foxp3 gfp Rag1 −/− mice expressing TCRs described in Table 1 (B8 and G113). Wild-type Foxp3 gfp (WT), and TCli αβ–TCR transgenic -Foxp3 gfp Rag1 −/− mice (origin of the TCRβ chain for B8 and G113) are shown as controls. (b) Summary of flow cytometric data. The frequency of Foxp3+ T cells in the CD4SP thymic (left) or CD4+ splenic (right) subset are shown (mean ± s.d., n=3). Data were obtained from 3 independent experiments.

