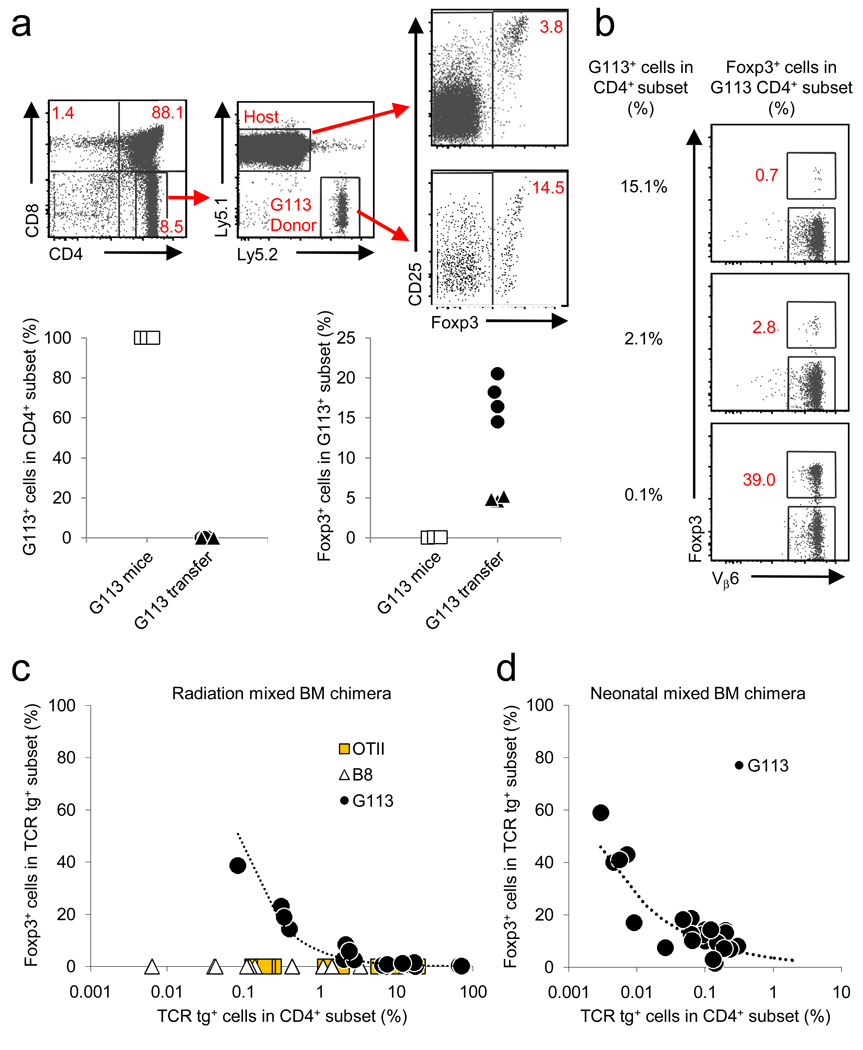
Figure 2.
An inverse relationship between TCR transgenic cell frequency and thymic Treg cell development. (a) G113 thymocytes (107) were intrathymically injected into congenic CD45.1 hosts, and analyzed by flow cytometry on day 3. The analysis scheme is illustrated in the FACS plots. The charts below show the percentage of CD45.2+ G113 cells in the CD4SP subset (left), and the percentage of Foxp3+ cells within the G113 population (right). Data from G113 transgenic Rag1 −/− mice (G113 mice) are shown for reference. The exact P-value from the Wilcoxon rank sum test between the percentage of Foxp3+ cells in the two settings is 0.017. Each symbol represents data from individual recipients from 2 independent experiments. (b–d) G113 BM was mixed with congenically marked wild-type BM at various ratios and injected into irradiated adult wild-type recipients or non-irradiated neonatal CD45.1 Foxp3 gfp recipients as described in the Methods. (b) Representative dot plots are gated on G113 CD45.2+CD45.1−CD4SP thymocytes from the radiation BM chimeras. The G113 TCR incorporates a Vβ6 chain. (c,d) Graphs show the frequency of G113 cells in the CD4SP subset versus the frequency of Foxp3+ cells. Each symbol represents an individual recipient. For radiation BM chimeras, 4 independent experiments were performed. For neonatal BM chimeras, 3 independent experiments were performed. Using a linear mixed model, we detected a significant difference between OTII or B8 and G113 (P < 0.01), but not between B8 and OTII (P = 0.41).

