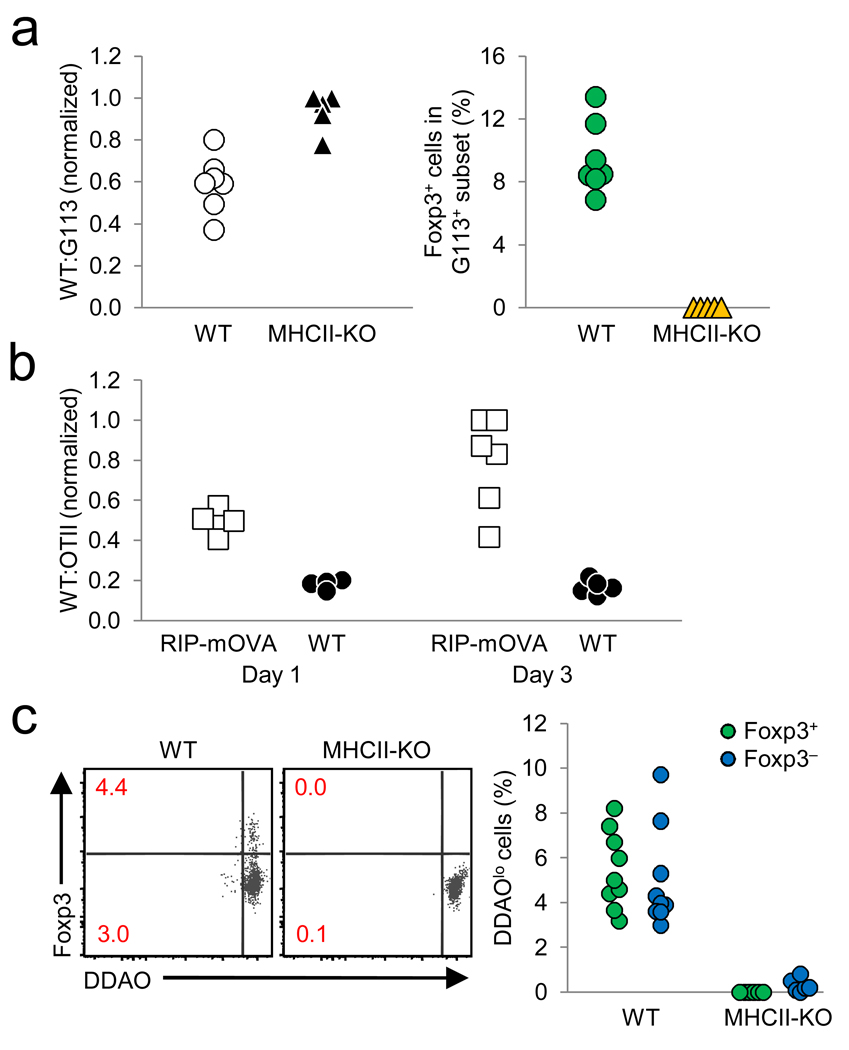
Figure 5.
No evidence for proliferation or negative selection during TCR-dependent G113 Treg cell development. (a) Wild-type and G113 Rag1 −/− thymocytes (1:1 ratio) were intrathymically injected into wild-type (WT) or MHC class II-deficient hosts. After three days, the ratio of remaining WT:G113 CD4SP cells (left), and the frequency of Foxp3+ G113 CD4SP cells (right) were determined by flow cytometry. The donor G113 cells were discriminated by DDAO labeling, CD45.2, and Thy1.2 expression; the co-injected wild-type cells by DDAO labeling, CD45.2, and Thy1.1 expression; and the host cells by CD45.1 expression. Each symbol represents an individual recipient. Data from 2 independent experiments are shown (3–4 WT and 2–3 MHC class II-deficient hosts per experiment), and were normalized by dividing the WT:TCR tg ratio with the highest value for a given experiment. (b) Whole thymocytes from OTII Rag1 −/− mice and Thy1.1 wild-type mice were mixed at a 1:1 ratio and intrathymically injected into congenically marked wild-type or RIP-mOVA mice and analyzed 1 and 3 days post-injection by flow cytometry. Data are from 2 independent experiments (5 WT and 5–6 RIP-mOVA recipients per experiment). (c) Sorted Thy1.1 wild-type and G113 Rag1 −/− HSAhi CD25lo Foxp3− CD4SP cells (5×10⁵ total at 1:1 ratio) were DDAO labeled and intrathymically injected into wild-type or MHC class II-deficient recipients, and analyzed by flow cytometry on day 3. Numbers in dot plots indicate the frequency of DDAOlo cells for the Foxp3+ and Foxp3− CD4SP cells; these frequencies are summarized in the graph on the right. Data are from 2 independent experiments using 9 WT and 6 MHC class II-deficient hosts.

