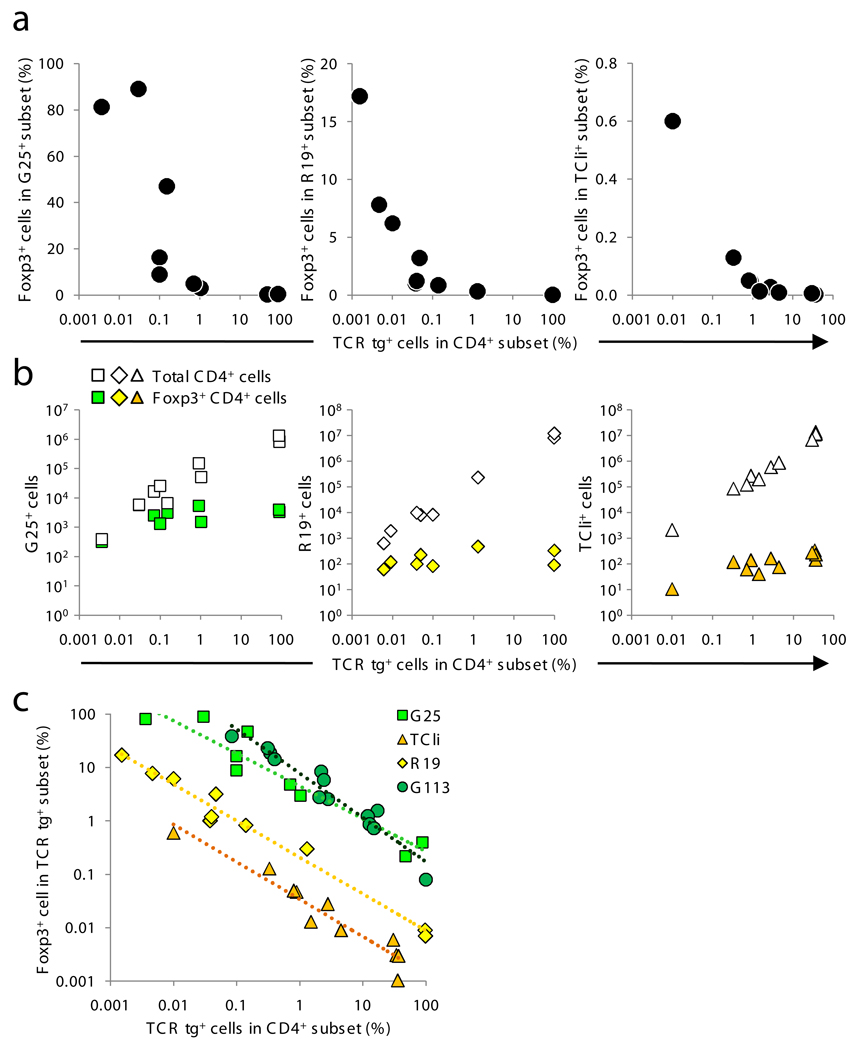
Figure 6.
Varying efficiencies of TCR-dependent Treg cell development. (a–b) G25 and R19 (Table 1) were retrovirally expressed in Foxp3 gfp Rag1 −/− BM and mixed with CD45.1 Foxp3 gfp BM at varying ratios. In the case of TCli, TCli-αβ TCR transgenic Foxp3 gfp Rag1 −/− BM was used. (a) Thymocytes were analyzed by flow cytometry as in Fig. 2b–c. (b) The absolute numbers of Treg and CD4SP thymocytes were plotted as in Fig. 3. Each symbol represents data from an individual mouse from 2 independent experiments (n=10–12). (c) Data are plotted as in Fig. 2c, except the frequency of Foxp3+ cells is on a log scale. Using a linear mixed model taking the percentage of CD4SP cells into consideration, we detected significant differences in pair wise comparisons between G113, R19, and TCli (P < 0.01), but not G113 and G25 (P = 0.08). The geometric means of percent Foxp3+ cells (±s.e.m.) for each TCR are: G113 (6.5 ± 1.0), G25 (4.3 ± 0.8), R19 (0.2 ± 0.04), and TCli (0.03 ± 0.006).

