
Figure 2.
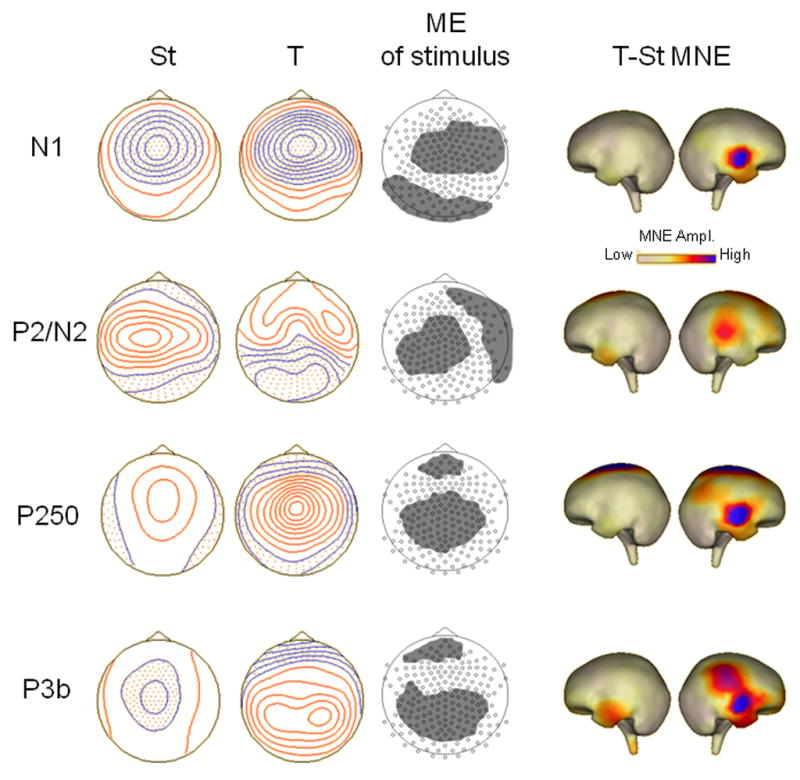
ERP components for which a main effect of stimulus was found. First two columns show top-down meridian maps of scalp potentials for each ERP component separately for standards (St) and targets (T), averaged over Ear of stimulation conditions. Positive isopotential lines are in red, negative isopotential lines are in blue; isopotential line scales are: .32 μV/step for N1 and P250, .16 μV/step for P2/N2, and .20 μV/step for P3b. Third column shows clusters of sensors, indicated by gray areas, within which significant ANOVA/cluster thresholding effects of stimulus were found (see Table 2 for the mean potential amplitudes averaged over sensors within each cluster). Last two columns show cortical maps (for left and right hemispheres) of minimum norm estimation (MNE) source analysis performed on the target minus standard difference ERP waveform. MNE maps are all on the same scale (in nA/m2 units).