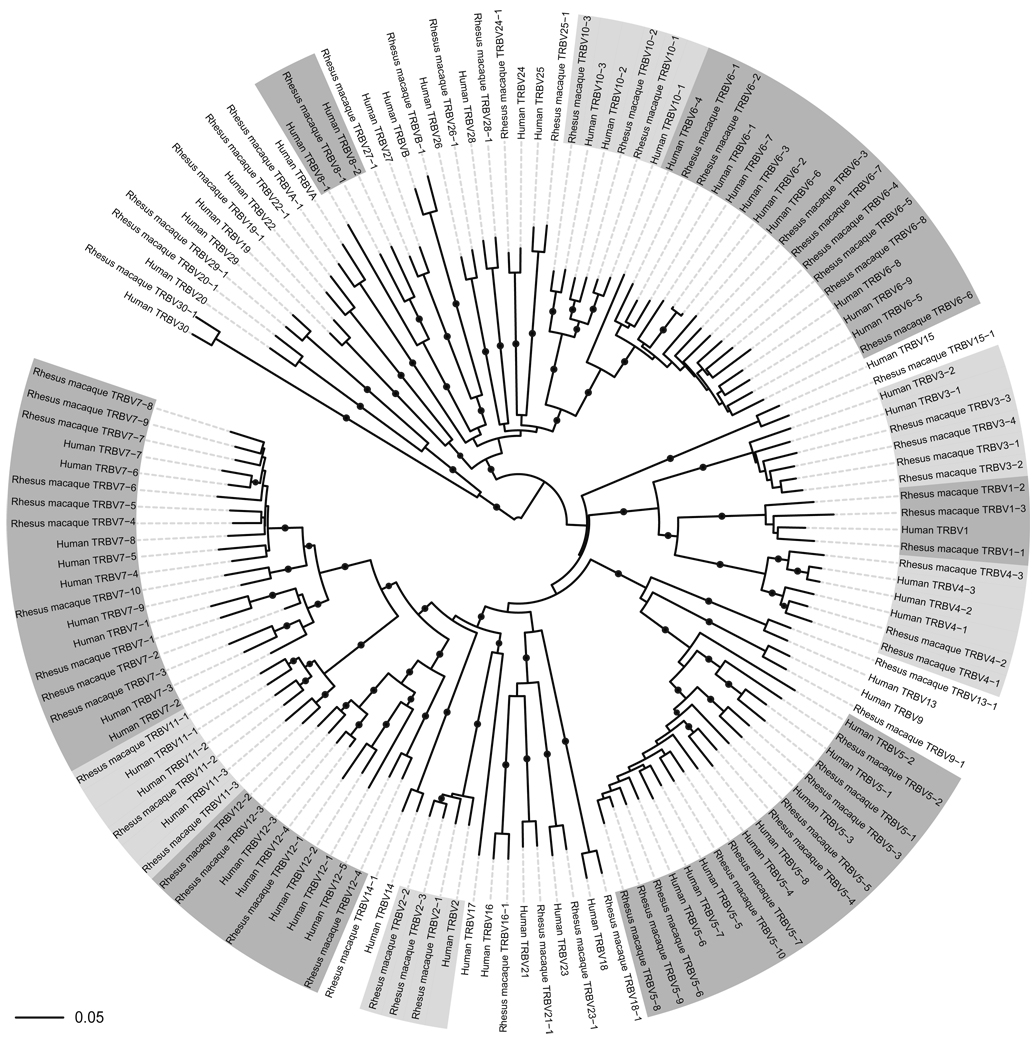
Figure 1. Unrooted circular phylogram showing the clustering relationships between all rhesus macaque and human TRBV gene sequences at the nucleotide level.
Exons, introns and recombination signal sequences have been included and gene families consisting of multiple genes are highlighted. All TRBV gene sequences were aligned using ClustalW and the tree was constructed in ClustalW using the neighbour-joining method49 and bootstrapped 1000 times. Branches with bootstrap values >80% are indicated with a black dot and branch lengths are those assigned by ClustalW. The tree was visualized using the Interactive Tree of Life50 (available at http://itol.embl.de/). Note that the tree has been rotated about the mid-point of the most distant nodes to assist visualization.

