
Fig. 3.
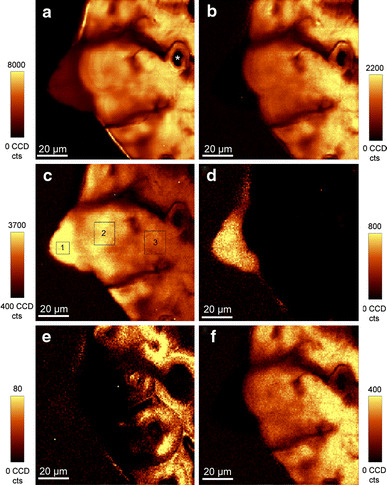
Raman images (100 × 100 μm) of the knob region calculated by integrating from 2,796 to 3,068 cm−1 (a, all organics), 1,002–1,199 cm−1 (b, carbohydrates), 2,25–5,80 cm−1 (c, amorphous silica), 931–1,013 cm−1 (d, silanol groups of silica), 844–875 cm−1 (e, pectin) and 874–934 cm−1 (f, mainly hemicelluloses)