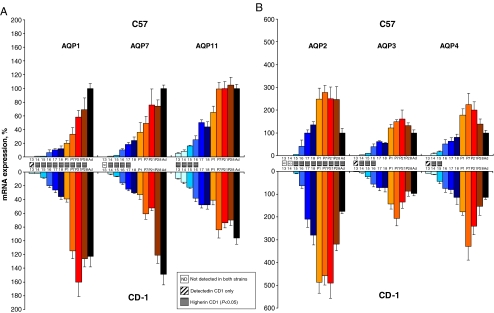
Fig. 3.
mRNA expression pattern of AQP isoforms during mouse kidney development and maturation: influence of the strain. Messenger RNA quantification of proximal (a AQP1, AQP7, and AQP11) and distal (b AQP2, AQP3, AQP4) AQP isoforms in fetal (E13.5 to E18.5, blue bars), postnatal (P1 to P28, orange bars), and adult (Ad, black bar) kidneys of C57 (n = 4) and CD-1 (n = 5) mouse strains. The mRNA expression levels were first normalized by Gapdh at every developmental stage, then adjusted to the adult level set at 100%. Significant differences (P < 0.05) between the relative abundance of AQP genes in C57 and CD-1 kidneys are indicated for the appropriate time points

