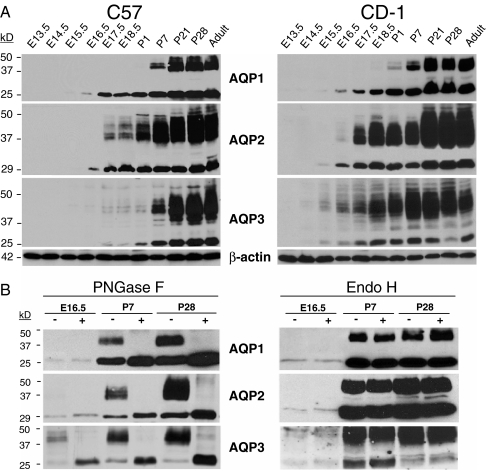
Fig. 5.
Expression and maturation of AQP1, AQP2 and AQP3 in the developing mouse kidney: immunoblotting and glycosylation analyses. a Representative immunoblotting analyses of AQP expression in membranes fractions of fetal (E13.5 to E18.5), postnatal (P1 to P28), and adult kidneys of C57 vs. CD-1 mouse strains. Equal amounts (20 µg) of protein were loaded in each line, and the blots were probed with anti-AQP1 (1:5,000), anti-AQP2 (1:1,000), anti-AQP3 (1:5,000), and anti-β-actin (1:10,000) antibodies. The AQP bands of about 24 to 28 kDa correspond to the non-glycosylated core, whereas bands of between 37 and 50 kDa correspond to the glyosylated isoforms. b Biochemical analysis of AQP1, AQP2, and AQP3 proteins during nephrogenesis. Immunoblot analysis of membrane fractions from CD-1 kidneys at E16.5, P7 and P28 stages. Samples were treated with endoglycosidase F (PNGase F) or endoglycosidase H (Endo H) and equal loads (15 µg) of deglycosylated and non-deglycosylated proteins were analyzed using the same antibodies than in a

