
Figure 6.
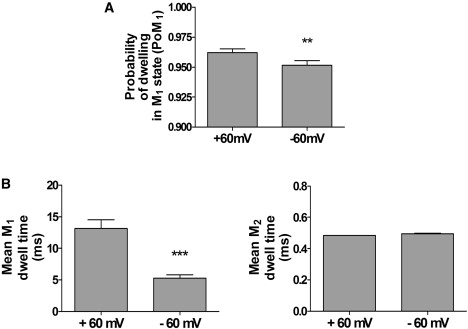
Voltage-dependent transitions between M1 and M2. (A) Histogram showing the probability of dwelling in the M1 state (PoM1) at +60 mV and −60 mV. (B) Histograms showing mean dwell times in the M1 and M2 states at both +60 mV and −60 mV. Mean ± SE for n = 8; ∗∗P < 0.01; ∗∗∗P < 0.001.