
Figure 1.
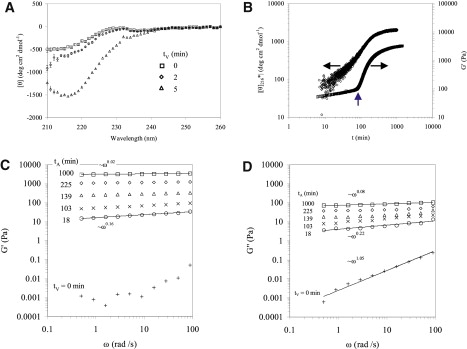
(A) Far-UV CD spectra collected immediately after vortexing silk solutions for different durations, tV. (B) Correlation between the time evolution of the increase in [θ]216 measured by CD and the shear storage modulus, G′ measured by dynamic oscillatory rheology during postvortex incubation. Rheology frequency sweeps of (C) storage and (D) loss modulus collected at different postvortex assembly times, tA, under the same assembly conditions as in panel B. The frequency sweep data collected from nonvortexed silk solution was also given in panels C and D for comparison (+).