
Figure 4.
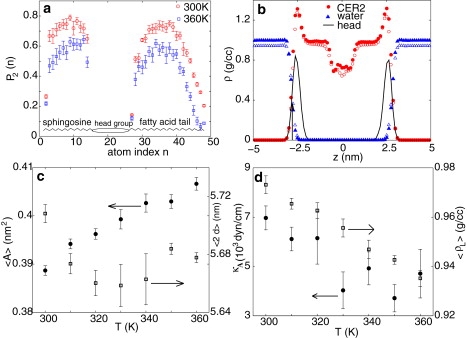
(a) Tail order parameter of CER atoms as a function of atom index n (see Fig. 1). (b) Density of CER atoms (circles), water molecules (triangles) for CER bilayer at 300 K (solid symbols), and 360 K (open symbols). The density of headgroup atoms at 300 K is shown with a solid line. (c) Area/lipid (circles, left y axis) and bilayer thickness (squares, right y axis) of CER molecules as a function of temperature. (d) Area compressibility (circles, left y axis) and average density (squares, right y axis) of CER bilayers as a function of temperature.