
Figure 7.
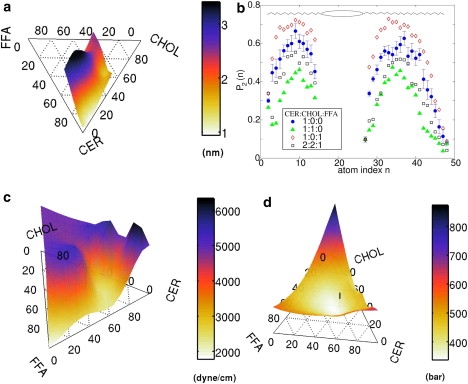
(a) Estimate of overlap λov of the CER tails from the two leaflets (Eq. 1) at 340 K. (b) Local tail order parameter P2(n) as a function of atom index n on a CER molecule (Fig. 1) for various compositions at 340 K. Error bars are shown for the pure CER data (circles). (c) Area compressibility modulus κA of the bilayers at 340 K. (d) Local stress (Eq. 5) in the bilayers associated with the difference in the lateral and the perpendicular components of the pressure tensor. The 2:2:1 composition is indicated with a vertical line.