
Figure 3.
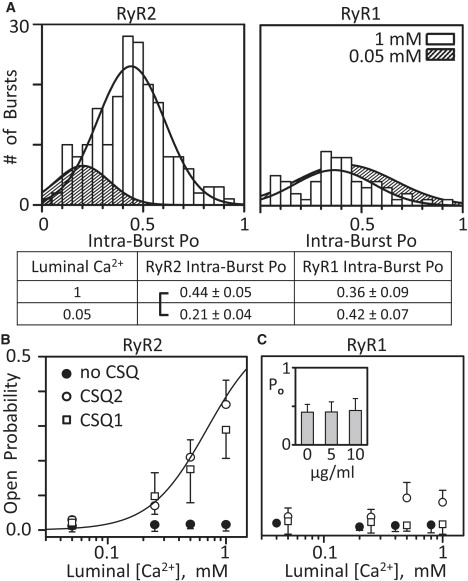
Intraburst open probability and luminal Ca2+ sensitivity of RyR2 and RyR1 channels. (A) Bursts with a minimum of five events/burst were detected in RyR2 (left) and RyR1 (right) recordings, and the intraburst Po was determined for each burst. Histograms of the intraburst Po, fit by a Gaussian distribution, at either 1 mM (open bars) or 0.05 mM (hatched area; bars not shown) luminal Ca2+ are shown. Luminal solution contained 5 μg/ml CSQ2 (left) and CSQ1 (right). Mean intraburst Po values (± SE) are shown below the graphs (bracket; p < 0.01; t-test). Results generated from five RyR2 and five RyR1 channels. (B) Summary RyR2 Po results. Native CSQ2 (open circles) or CSQ1 (squares) was added (5 μg/ml) to the luminal side of CSQ stripped channels. Solid circles are the results with no CSQ present. The line represents the luminal Ca2+ sensitivity of RyR2 channels before CSQ was stripped (taken from Qin et al. (14)). The cytosolic free Ca2+ was 0.75 μM (no Mg or ATP present) and points are mean ± SE of six to eight channels. (C) Summary RyR1 Po results. Symbols are as in B. Solid circles are shifted to avoid symbol overlap. (Inset) RyR1 Po as a function of 0, 5, and 10 μg/ml CSQ1 concentration, with average (± SE) Po values of 0.42 ± 0.10, 0.43 ± 0.13, and 0.45 ± 0.15, respectively. Here, the cytosolic solution contained 20 μM free Ca2+, 1 mM free Mg2+, and 5 mM total ATP. The luminal solution contained 100 Cs-methanesulfonate, 1 mM Ca2+, and 1 mM Mg2+. These results are from four RyR1 channels.