
Figure 2.
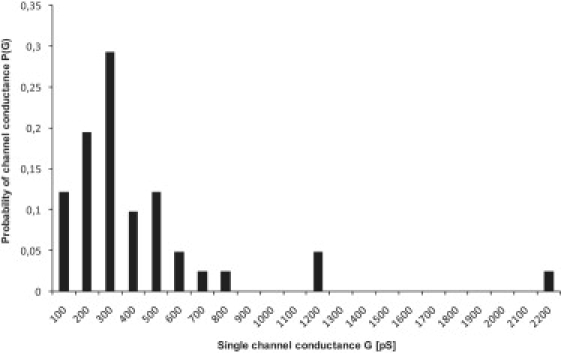
Histogram of the probability for the occurrence of a given conductivity unit observed with membranes formed of DPPC/n-decane in the presence of warnericin RK. P(G) indicates the probability with which a given conductance increment G was observed in the single-channel experiments. It was calculated by dividing the number of transitions with a given conductance increment by the total number of conductance fluctuations. The average single-channel conductance of the right-hand maximum was ∼500 pS for 70 conductance fluctuations. The aqueous phase contained 1 M KCl and 0.4 μM warnericin RK, and the applied voltage was 20 mV; T = 20°C.