
Figure 6.
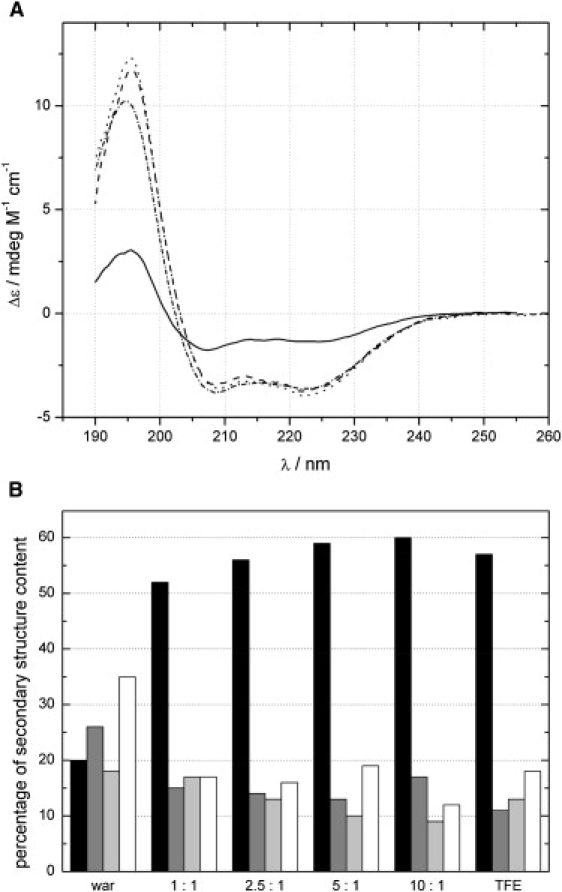
CD spectroscopy of warnericin RK. (A) CD spectra of pure warnericin RK (solid line), with 8% TFE (dashed-dotted line) and in the presence of DMPC (1:2.5, dashed line; 1:10, dotted line). (B) Content of secondary structure as derived from the CD spectra. Black bars: helical; dark gray bars: extended conformation; light gray bars: turn; empty bars: random coil.