
Figure 2.
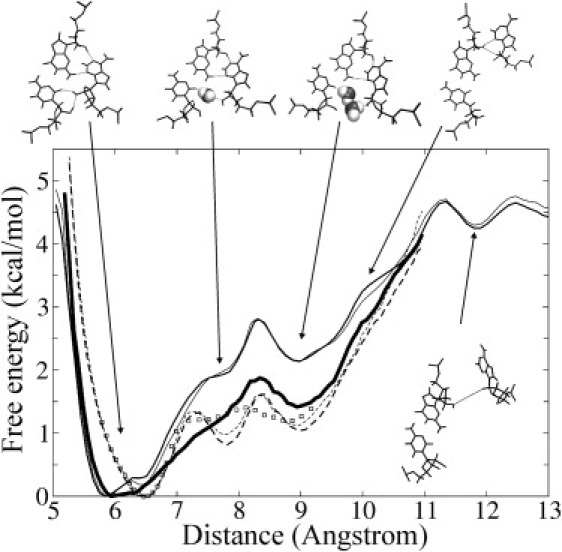
Calculated PMF for the opening of the kt38 K-turn motif along the reaction coordinate δ. The reaction coordinate δ corresponds to the distance between the geometric center of the adenine (A1032) and the guanine (G940):cytosine (C1026) basepair of the second A-minor interaction. Thin lines correspond to PMFs calculated in the forward (full line) and backward (dashed line) simulations, respectively. Hair lines correspond to a data-gathering time of 1 ns per umbrella-sampling interval. Thin lines indicate the same simulations but extended to 2 ns per interval. The bold line is the PMF obtained by using the REUS method with starting conformations in each window as obtained after the forward (full line) or backward (open squares) umbrella-sampling production runs. Representative simulation snapshots of the second A-minor interaction (G940:C1026 basepair and A1032) for each phase of the umbrella-sampling simulation are shown as stick models (inserted water molecules in van der Waals representation). The third and fourth conformations represent semi-open structures, and the last stick model corresponds to a fully open kt38 structure.